Statistics
| © 2004 Rasmus ehf |
Statistics |
Lesson 2.
Mean, median and mode.
Mean (average)
Example 1.
|
The graph shows the height of 5 twelve-year-olds (in cm). |
|
| Sandra is 143cm. |  |
| Katie is 150cm. | |
| John is 145cm. | |
| Bud is 165cm. | |
| Sigrid is 152cm. | |
To find the mean height of the
children, add their heights together and divide by the number of children.
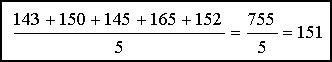 The
answer is
151cm.
The
answer is
151cm.
The mean height is 151cm. (Note: All the measurements are in cm.)
Median
Example 2. Look at the mean height of five other children:
Gwen 149 cm, Paul 192 cm, Andrew 151cm, Sue 153cm, Eve 155cm
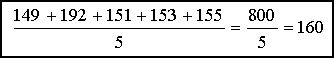 The
answer is 160cm.
The
answer is 160cm.
The mean height is 160cm. (Note: All the measurements are in cm.)
The median is found by arranging the numbers in order of size and finding the middle number.
Arrange the heights of the children from
Example 2 in order of size.
We
see that the middle number is 153cm.
So the median is 153cm. (Note: Mean is not the same as median.)
Now we will find the median for all the children in both examples above.
Arrange the values in order of size:
143 cm, 145 cm, 149 cm, 150 cm, 151 cm, 152 cm, 153 cm, 155 cm, 165 cm, 192 cm.
The median is found by finding the mean (average) of the two values in the middle.
The median is 151.5 cm.
When there is an even number of values, the two values in the middle are added together and then divided by 2.
Mode
The mode is the value that occurs most frequently.
Example 3.
Look at the bar graph for cinema visits by teenagers from Lesson 1.
The number of cinema visits a month that has the greatest
frequency is 1. Four of the teenages went to the cinema once a month.
Therefore the mode is 1.
Practice these methods and then try Quiz 2 on
Statistics.
P.S. Remember to fill in your Check list as you go
through the exercises and quizzes.