© 2008 Rasmus ehf
and Jóhann Ísak
© 2008 Rasmus ehf |
Inequalities |
How
can we solve a quadratic inequality such as x2 − 1
![]() 0 ?
If
we solve the corresponding quadratic equation we get two solutions.
0 ?
If
we solve the corresponding quadratic equation we get two solutions.
x2 − 1 = 0
(x + 1)(x − 1) = 0
Solutions: x = 1 and x = −1.
We
have found the points where the expression is 0, we now have to find where
it’s less than 0. In other words we have to find out when the expression is
negative. To do this we look at the signs of the
factors (x + 1) and (x − 1) . In other words we look for the
intervals in which they are positive or negative. To do this we make a “table
of signs”
We begin by putting in 0 at the values where each of the
factors is zero. (x+1) = 0 when x = −1, and (x − 1) = 0
when x = 1. We then put in + or − depending on whether the factors are
positive or negative. We can now use
this information to solve the inequality.
We know that (x + 1)(x − 1) = x2 − 1.
We also know that −∙− = + and +∙+
= +. This means that the expression (x + 1)(x − 1)
is positive when both brackets have the same sign and negative when they
have opposite signs. Now we can complete the table. We are looking for the
interval on which x2 − 1 < 0, that is negative.
This interval satisfies the inequality.
−1
![]() x
x
![]() 1
1
Now let’s solve the inequality without factorising
first.
We simply find the roots by solving the corresponding
equation and then put in any x - value between these roots. .
If we choose for example x = 0 we get the following
If f(x)
= x2 − 1 then f(0) =
02 − 1 = −1.
This shows us that f(x) = x2 − 1 is negative on the interval
−1
![]() x
x
![]() 1 .
1 .
If we try any x value that is less than −1 og
greater than 1 we get positive values for the function. So the Real Number line
will look like this:
Solution
We can also find the solution by looking at the graph of
f(x) = x2
− 1 . The solution of x2
− 1
![]() 0
is the interval where the graph lies on or below the x− axis.
0
is the interval where the graph lies on or below the x− axis.
Look at the graph below.
The graph lies on or undir the x - axis
on the interval −1
![]() x
x
![]() 1
(the shaded area of the graph).
1
(the shaded area of the graph).
If we turn the inequality sign round what is the solution
of
x2 −
1
![]() 0?
0?
Looking at the graph , the area above the x- axis
satisfies this condition. If we look at the table of signs it’s where the
expression is positive.
Solution: x
![]() −1
Solution: x
−1
Solution: x
![]() 1
1
The solution of the inequality x2
− 1
![]() 0
is in two parts.
0
is in two parts.
x
![]() −1
or x
−1
or x
![]() 1.
1.
Solve the inequality x2 − 2x − 3 < x + 1.
First
we solve the corresponding equation
x2 − 2x − 3 = x + 1
x2 − 3x − 4 = 0
(x + 1)(x − 4) = 0
Solution: x = −1 and x = 4
Next we make a table of signs.
Solution: −1 < x < 4
If we draw two graphs in the same coordinate
system
f(x) = x2 − 2x
− 3 and g(x) = x + 1 then we are looking for the area in which f(x) ( the
left hand side of the expression ) is less than g(x) ( the right hand side ).
This is the shaded area of the graph, where x takes values between -1 and
4.
| Solve the inequality |
 |
We begin by looking at the signs of the numerator (x +
1) and the denominator (x − 1). The same rules apply for division
as for multiplication. (−/−
= + and −/+ = −). So if the numerator and denominator have the same
sign the outcome is positive. If they have opposite signs then the outcome is
negative
Solution
Now we need to take care as x cannot be equal
to 1 because then we would be dividing by 0.
The solution is therfore −1
![]() x
< 1.
x
< 1.
We draw the graph, first making a table of values.
|
X |
f(x) = (x + 1)/(x - 1) |
 |
| -2 |
≈0.3 |
|
| -1 | 0 | |
| 0 | -1 | |
|
½ |
-3 | |
| 1 | asymptote | |
|
1½ |
5 | |
| 2 | 3 | |
| 3 | 2 |
The graph has a vertical asymptote when x = 1 and lies under the x – axis on the interval between −1 and 1 (the shaded area).
Solve ![]()
We begin by moving 1 over to the other
side of the equation leaving 0 there. We can only use a table of signs if the
right hand side is zero.
 |
We
find the common denominator and simplify the fraction. |
Next we make a table of signs.
Solution x < 1
We now draw graphs of the left hand side
and the right hand side of the inequality. The left hand side is the same as in
example 2. The right hand side g(x) = 1 (a horizontal line, one unit above the x
axis ).
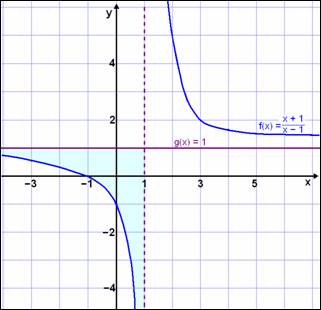
We see that the graph of f(x) is under the graph of g(x) for all x values to the left of the vertical asymptote x = 1 (see theshaded area ). x = 1 is not included in the solution as that would mean we were dividing by zero.
Solve the inequality x2 <
![]() x.
x.
The equation x2 =
![]() x
has solutions
x = 0 and x = 1.
x
has solutions
x = 0 and x = 1.
x2 <
![]() x
x
x2 −
|
Arrange both terms on the left hand side |
Choose a value of x between 0 and 1 for example ¼ and put
the value into the function.
f(x) = x2 −
![]() x
x
The outcome is negative so the sign of f(x) is as shown
below.
![]()
![]()
![]()
does not exist
Solution: 0 < x < 1
Now look at the graph of the left hand and right hand
sides.
The graph of f(x) = x2 is below the graph of g(x)
=
![]() x on
the interval 0 to 1.(see the shaded area).
x on
the interval 0 to 1.(see the shaded area).
Solve the inequality ln x
![]() ln 1/x.
ln 1/x.
We simplify as much as possible and move both the terms to the left hand side of the equation.
| ln x
|
|
x
|
|
x2
|
| x2 − 1
|
| (x
+ 1)(x − 1)
|
Now we can use a table of signs to solve the inequality.
We limit our calculations to positive values of x as the logarithm of negative
values does not exist.
Solution: 0 < x
![]() 1
1
Now let’s look at a graph.
We see that the graph of f(x) lies below the graph of g(x) for values of x between 0 and 1 ( see the shaded area of the graph ).
Try Quiz 2 on Inequalities.
Remember to use the checklist to keep track of your work.