© 2009 Rasmus ehf and Jóhann Ísak
|
© 2009 Rasmus ehf and Jóhann Ísak |
Functions 2 |
|
Lesson4
Investigating functions using derivatives
The derivative of a function is a measure of the gradient of the graph so we can therefore draw the following conclusions:
|
A function is increasing if the derivative is positive (+) and decreasing if the derivative is negative (–). |
This means that when the derivative changes sign from positive to negative or negative to positive there must be a turning point or vertex on the graph. These are called maximum and minimum points. They are not necessarily the greatest or smallest overall values of the function.
Looking at a table of signs of the derivative shows us where these stationary points occur.
Remember, a continuous function cannot change between negative and positive values without going through zero, therefore we look for stationary points by finding out when the derivative is 0.
Example 1
Find the derivative of f(x) = x2, make a table of signs, and use this to draw the graph of f(x).
If f(x) = x2 then f´(x) = 2x.
The stationary points occur when f´(x) = 2x = 0 , that is when x = 0. The following is a table showing the sign of f´(x)

Y = x2
The derivative is 0 when x = 0 and the gradient changes from – to + so so this is a minimum point.
Example 2
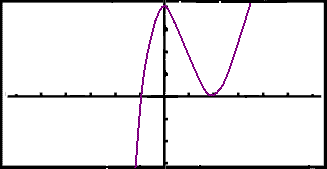
Find the derivative of f(x) = x3 – 3x2 + 4, make a table of signs for the derivative and use this to find the stationary points. Compare your results with the graph shown in your graphical calculator.
If f(x) = x3 – 3x2 + 4 then f´(x) = 3x2 – 6x.
Find where the derivative is 0.
3x2 – 6x = 0
3x(x – 2) = 0
This equation has the solutions x = 0 and x = 2 and the derivative changes sign in these points. We find the sign of f´(x) = 3x2 – 6x.

We could have made the table without factorising first, simply by choosing values of x between the zeroes and find the sign of the derivative.
f´(–1) = 3(–1)2 – 6(–1) = 3 + 6 = 9 (+)
f´(1) = 3·12 – 6·1 = –3 (–)
f´(3) = 3·32 – 6·3 = 9 (+)
This gives a simpler table than above but shows the same information.

From the table we can deduce that we have a maximum when x = 0. The gradient is 0 so the graph is horizontal and the gradient changes from + ( going up ) to – (going down).The derivative is also zero when x = 2 and the gradient changes from – to + so here we have a minimum. We can find the maximum and minimum values of the function by putting these x values into the formula for the original function.
f(0) = 03 – 3·02 + 4 = 4
The function has a maximum value in the point (0, 4).
f(2) = 23 – 3·22 + 4 = 8 – 12 + 4 = 0
The function has a minimum value in the point (2, 0).
A graphical calculator shows the following graph.
 |
 |
Sometimes the derivative of a function is zero without the sign of the derivative changing as it goes through the zero point. In such cases there is no stationary point but what is called a point of inflexion.
Example 3
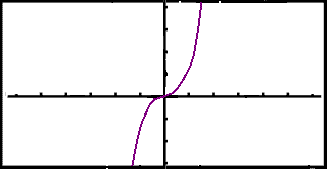
Let's examine the function f(x) = x3.
The derivative is f´(x) = 3x2 and is zero when x = 0.
The following is a table of signs for the derivative.

The point (0, 0) is a point of inflexion. The graph is increasing up to x = 0, is horizontal in x = 0 and then carries on increasing after 0.
 |
 |
Calculations using the derivative have many practical applications, particularly in finding maximum and minimum values. The following two examples demonstrate this.
Example 4
We wish to make a cardboard box using a square piece of card with a side of 1 m. To do this we bend the corners as shown in the diagram. How much do we need to cut out of the corners in order for the box to have as big a volume as possible?
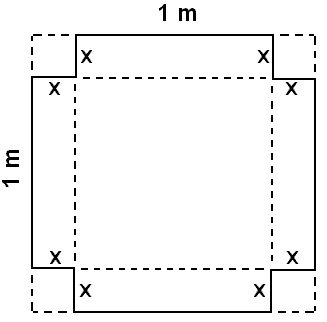
Call this x , which means the length of each side of the box will be 2x shorter than the card, that is 1 – 2x . The height of the box will also be x, and the volume V can be written as follows:
V = height·length·breadth
= x(1– 2x)(1 – 2x)
= x(1 – 4x + 4x2)
= x – 4x2 + 4x3
Differentiating this and finding when the derivative is 0 gives us:
V´ = 1 – 8x + 12x2 = 0
This is a quadratic equation that can be solved by using a calculator or the quadratic formula.
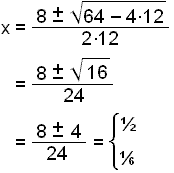
It's obvious that we
can't have x = ½, as if we cut off ½ a metre there will be no
box left. So this must give the minimum value of the volume. The maximum volume
will be when
x = ![]() .
.
V(![]() ) =
) = ![]() (1
– 2·
(1
– 2·![]() )(1 – 2·
)(1 – 2·![]() ) =
) = ![]() m3
m3
The maximum volume of the
box will be
![]() m3
when we cut
m3
when we cut ![]() m from each corner.
m from each corner.
Example 5
A rectangle is drawn as shown in the diagram. One side is formed by the line y = 3 and one corner, P, lies on the graph of f(x) = x2 . Find the coordinates of the point P in order for the rectangle to have the maximum possible area.
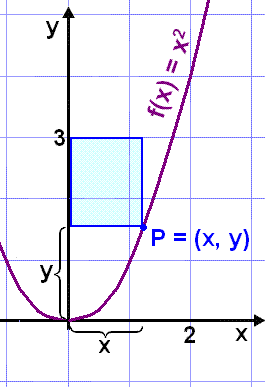
The sides of the rectangle are x and 3 – y or 3 – x2 as the point P lies on the graph of f(x) = x2. The area is therefore
A = length·breadth
= x·(3 – x2) = 3x – x3
Diferentiating this and finding where the derivative is zero gives:
A´ = 3 – 3x2 = 0
3 = 3x2
x = ±1
The rectangle is in the positive quadrant so we can't have x = –1. The maximum area is when x = 1 so we can put this value into the formula for the area.
A = 3x – x3
= 3 – 1 = 2
Practise these methods then try
Quiz 4 on Functions 2.
Remember to use the checklist to keep track of your work.